Snacks and Beverage Sales Up in Convenience Stores, Report Shows
by
Convenience stores in the United States experienced record in-store sales of $233.0 billion in 2016—and the third straight year of $10 billion-plus in pretax profits—according to newly released NACS State of the Industry data, the convenience and fuel retailing industry’s premier benchmarks and key performance category insights.
Here’s how some in-store sales performed in 2016:
Foodservice (prepared and commissary food; hot, cold and dispensed beverages): 21.7 percent
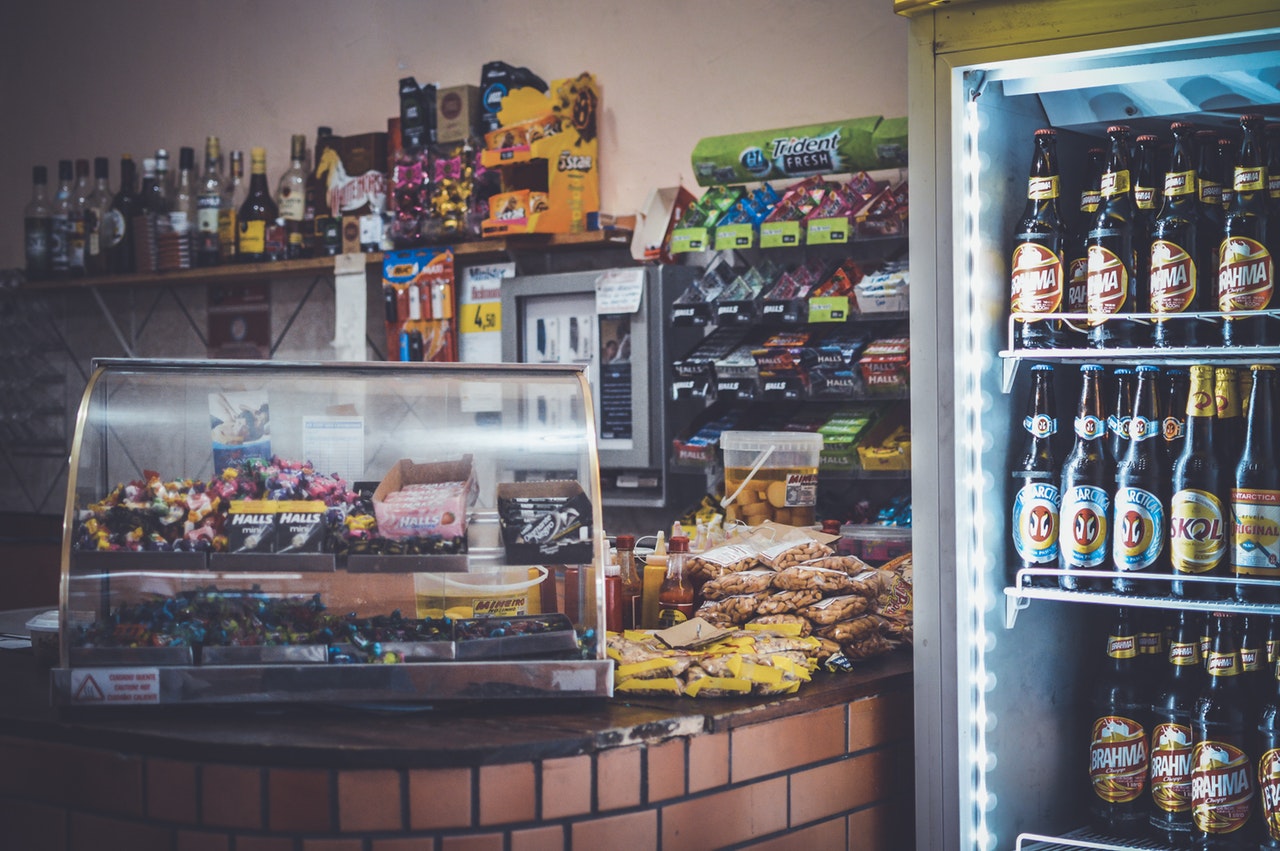
Packaged beverages (carbonated soft drinks, energy drinks, sports drinks, water, juices and teas): 15 percent
Center of the store (salty, candy, packaged sweet snacks and alternative snacks): 9.8 percent
Foodservice, a broad category that includes prepared and commissary foods, hot dispensed beverages (coffee) and cold (fountain) and frozen dispensed (slushee) drinks, continues to be a key focus for growth in the convenience store channel. Foodservice contributed 21.7 percent of in-store sales in 2016 and accounted for 35.2 percent of gross profit dollars, with prepared food and cold dispensed beverages driving the category’s growth. In 2016, convenience stores experienced growth in every foodservice subcategory except for commissary and frozen dispensed beverages.
Packaged beverages (non-alcohol) accounted for 18.5 percent of gross profit dollars. Within the category, enhanced water (12.3 percent increase in sales), sports drinks (4.5 percent) and bottled water (3.9 percent) led sales growth from the cooler in 2016, signaling a move by consumers toward healthier and/or functional beverage options.
Snacking categories, including salty, candy and alternative snacks, all had strong growth as some consumers, especially millennials, moved toward snacking and away from traditional meals. For the second consecutive year, alternative snacks, a category driven by protein- and energy-rich items, reached the top 10 in-store merchandise categories, also signaling a desire by consumers for immediate/healthier snacking options.
Despite record in-store sales, direct store operating expenses (DSOE), encompassing wages, payroll taxes, health-care insurance, card fees, utilities, repairs/maintenance and supplies, as well as several other categories including franchise fees and property taxes, outpaced inside gross profit dollars for the second consecutive year. This trend is creating challenges for convenience retailers as they look to grow their businesses.
The industry’s 2016 metrics are based on the NACS State of the Industry survey powered by its wholly owned subsidiary CSX LLC, the industry’s largest online database of financial and operating data. Complete data and analysis was released in June in the NACS State of the Industry Report of 2016 Data.

Subscribe Now
![]()
The Latest Snacking Trends

See What’s New in the Snack Aisle
Specials
Find it HERE first!